Vibrant Valenzuela
CITY PROFILE
Background
Land Area: 4,459.4 hectares or 44.59 km2
Population: 675,979 (2021 projected)
Households: 164,873 (2021 projected)
Classification: Highly-Urbanized City
Total Income: PhP 5,179,506.003 (2019)
No. of Businesses: 19,912 (2019)
BRIEF HISTORY
The city traces its long colorful history to the Old Town of Polo, then part of the province of Bulacan, which was established in 1623. It began as a tiny settlement of fishermen along the coast of Manila Bay. Polo was later renamed Valenzuela, in honor of its most famous son, Dr. Pio Valenzuela, one of the triumvirates of the Katipunan (revolutionary movement during the Spanish occupation). In 1975, it formed part of Metropolitan Manila after its creation. It became a city in 1998 when President Fidel V. Ramos signed RA 8526, an act passed by congress, as authored by the late Congressman Antonio M. Serapio, classifying Valenzuela as a highly urbanized city
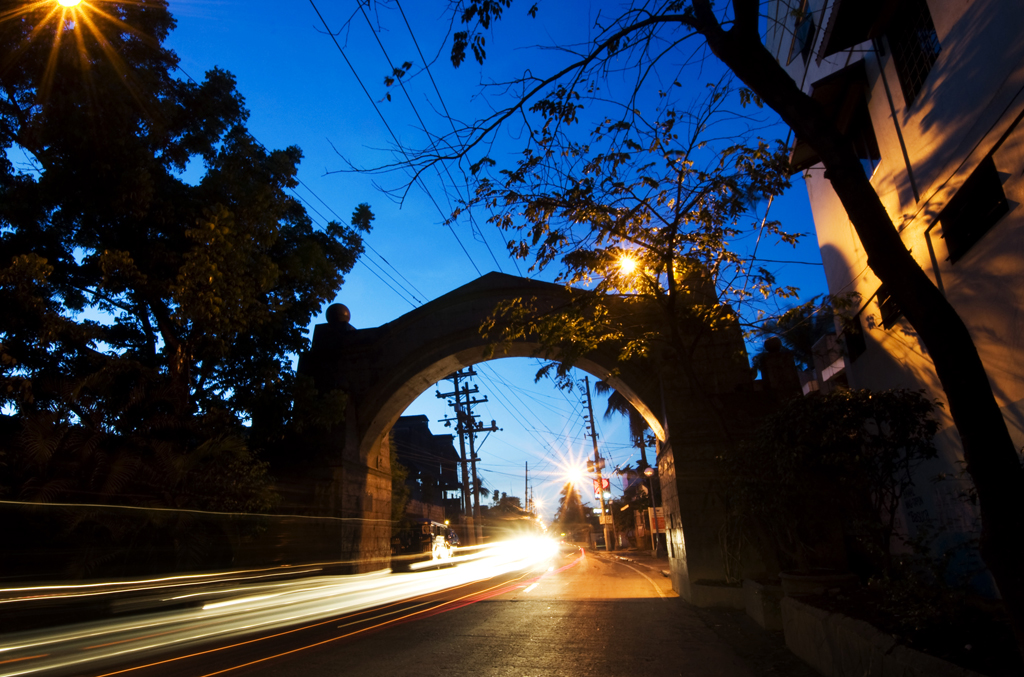
Valenzuela, The Vibrant City, once a quaint provincial town during the colonial times, is now regarded as one of the country's most liveable cities, and among the preferred residential, cultural and business destinations.
Today, it is considered as a hub of governance best practices and innovations as evident by the accolades it has been receiving from numerous reputable award-giving institutions; such as the Galing Pook Awards, Cities and Municipalities Competitiveness Index, Seal of Good Financial Housekeeping, and Most Business-Friendly City Award, among others.
GEOGRAPHY
The city is bordered by Quezon City and northern Caloocan City to the east; Malabon City and southern Caloocan City to the south; Obando in Bulacan province to the west; and Meycauayan City, also in Bulacan province, to the north.
ECONOMIC REFORM AND DEVELOPMENT
The City of Valenzuela is known as the “Northern Gateway to Metropolitan Manila” due to two major highways traversing it – the MacArthur Highway and the North Luzon Expressway.
Its proximity to the cities of Manila, Quezon and Caloocan has transformed this once idyllic town into a bustling highly urbanized city. Small and large-scale industries like food products, metals, plastics, and textiles flourish in the area, which are all contributory to the town’s accelerated economic growth. The continued physical development in the city brought it more fame and fortune, enabling it to earn the reputation of being an “economic miracle of the decade.” This industrial development also provided a rich source of employment to the growing labor force, thereby, further uplifting the economic status of the residents.